Nanoscale Materials and Bioanalytical Chemistry Laboratory
Research - AFM
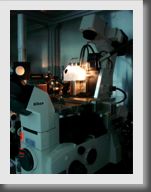
Left: Veeco Bioscope SZ AFM, Right: AFM working configuration (Veeco)
A. Surface Structures of Chromaffin Cells
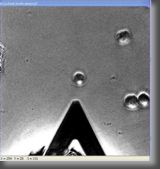
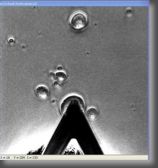
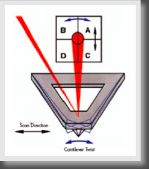
The surface of a chromaffin cell (circles) was scanned by an AFM cantilever (triangle).
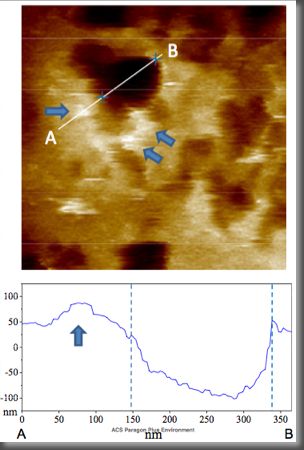 |
(upper) AFM image of the depression on the surface of a chromaffin cell under high-K+ buffer stimu-lation. The chromaffin cell was fixed and stained with antibody against SytI, which was identified by AFM imaging with assistance of the labeling 30-nmgoldparticle tagged 2nd antibody. Arrows indicate the gold nanoparticles, which help to locate a depression (in dark brown color). (lower) The trace is a cross-section analysis, along the white line AB drawn in the upper AFM image, for the depression and a 30-nm gold particle. The width of the depression is 190 nm marked between two dash lines.The height (~30 nm) of a gold nanoparticle is pointed by an arrow. (J. Phys. Chem. B, 112, 9165-9173 (2008)) |
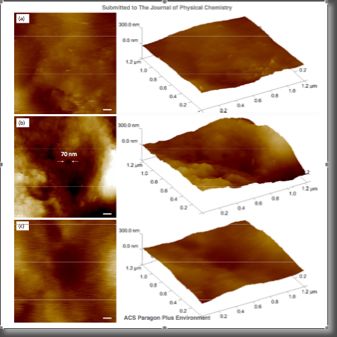
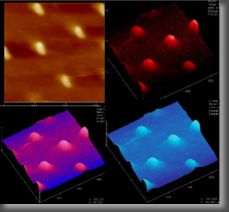
AFM images for fixed chromaffin cells with different stimulations. (a) A control cell without stimulation. (b) The cell was stimulated with 30 μM histamine for 2 min and then fixed. (c) The cell was pretreated with 10μM mepyramine for 15 min and then stimulated with 10μM histamine for 2 min. The scale bars are 100 nm. Shown on the right side are their corresponding 3D images. (J. Phys. Chem. B, 112, 9165-9173 (2008))
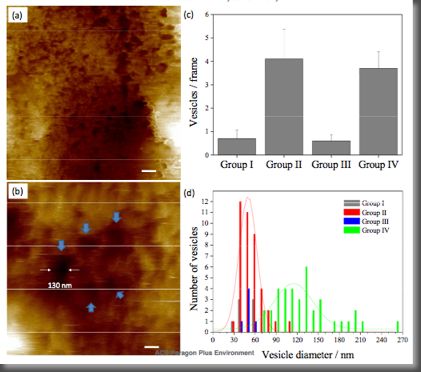
Different pore sizes with different stimulations obtained by AFM imaging. The cells were stimulated with histamine (Group II), mepyramine-pretreated before histamine stimulation (Group III), high-K+ buffer (Group IV), or without stimulation (Group I), and then fixed for AFM scanning. (a) A Group II cell with lots of depressions. The scale bar is 100 nm. (b) A Group IV cell with 5 depressions as indicated by arrows. The leftmost depression is estimated to be formed from a vesicle of 130 nm in diameter. The scale bar is 100 nm. (c) Averaged number of vesicles/depressions per AFM scanning frame. Only depressions with depth and width over 20 and 30 nm, respectively, were counted as fusion pores. Data presented are Mean ± SEM from 10 scanning frames in each group. (d) Histogram of the estimated vesicle diameters. The data are fitted with Gaussian distribution functions to estimate the vesicle diameters (red: Group II; green: Group IV). Thecenter of the distribution indicates the averaged vesicle diameter of 50 nm and 115 nm for Groups II and IV, respectively. (J. Phys. Chem. B, 112, 9165-9173 (2008))
B. Structural Characterization
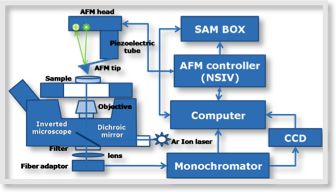
C. AFM combined with optical Microscope