Combining Molecular Beam, Mass Spectrometry and Laser Spectroscopy to Probe Isomers of Benzene Derivatives and Sandwich-typed Organometallic complexes
1. Introduction
Although mass spectrometry and spectroscopic techniques are widely used to analyze various compounds and even explore molecular dynamics and reaction mechanisms, all scientific analytical instruments have their limits. Due to the same molecular weight of isomers, mass spectrometers cannot be used to identify molecular isomers directly. For some molecular isomers, it may be possible to deduce the structures by analyzing the ion fragments. But the process is complicated. Due to molecular motions at room temperature, the peaks of the traditional gas spectrum are very broad. Due to the solvent effect, the condensed state spectrum will be even more challenging to distinguish isomers. When the compound sample contains impurities, the analysis of species adds another dimension of difficulty.
Due to the different structures, there are many types of molecular isomers. From the literature, scientists have accumulated their knowledge to understand that the electronic excitation energy and ionization energy (IE) of most molecular isomers differ only by a few to a few hundred wavenumbers.1 Therefore, an ideal method to distinguish molecular isomers is to combine molecular beam, mass spectrometer and high-resolution laser spectroscopy. This article introduces a method for resolving impurities and identifying various types of molecular isomers.
In 1984, Müller-Dethlefs and Schlag developed a high-resolution ion spectroscopy technique called zero kinetic energy (ZEKE) photoelectron spectroscopy.2,3 It uses the molecular beam method to prepare molecules in the ground electronic state. Then it uses lasers to excite the molecules to a very high Rydberg state (principal quantum number n usually exceeds 100) with long life. It then applies a pulsed electric field to ionize the neutral Rydberg molecules.4,5 By detecting the ZEKE electrons, one obtains highly accurate adiabatic IE and ion spectrum which provide information about vibrations and even rotations of molecular ions. The resolution of the ion spectrum measured by this unconventional ZEKE spectroscopy is more than 100 times higher than that of traditional photoelectron spectroscopy. It is known that electron is indistinguishable from the original sources. The major drawback of ZEKE spectroscopy is that it does not provide mass information.2,3 In 1991, Johnson and coworkers developed a method to detect ZEKE ions rather than ZEKE electrons. They referred the new technique as mass-analyzed threshold ionization (MATI) spectroscopy.6 Readers may consult the book written by Telle, Urena and Donovan7 to learn about molecular beam, laser, and many related spectroscopic techniques.
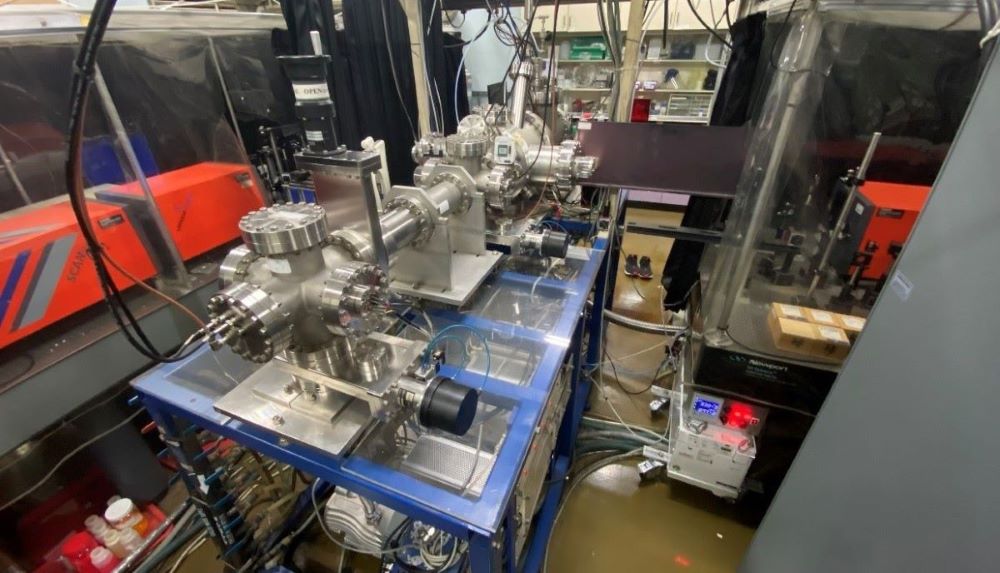
We built a pulsed molecular beam two-color resonance-enhanced multiphoton MATI spectrometer in 1998. Its appearance is roughly shown in Figure 1. Some of the instrument parts and operational procedures have been described in our previous publications.8,9 We have used this sophisticated apparatus to study more than 130 multiply substituted benzene derivatives and their isomers, as well as many sandwich-type organometallic complexes. The obtained valuable data include (1) accurate electronic excitation, (2) accurate adiabatic IE, (3) vibronic spectrum, and (4) vibrationally resolved cation spectrum. These new experimental data allow us to identify molecular isomers and to study the substituent effects on the electronic excitation energy and adiabatic IE, as well as the active vibrations in the electronically excited and cationic states, such as (1) heavy atom effect,10 (2) carbon chain length effect,11 (3) relative position effect of substituents on the ring,12 (4) heavy atom effect,13 (5) configuration effect of two substituents,14 (6) addition effect of substituent,15 etc. In addition, we can have insights into the photophysical and photochemical properties of isomeric molecules. For example, there is a significant difference in the structural change between the electronically excited and ionic states of 1-methylnaphthine and 2-methylnaphthine.16
|
|
| Figure 1: Pulsed molecular beam two-color resonance-enhanced multiphoton MATI spectrometer in Lab 108 of IAMS, Academia Sinica |
A more advanced MATI spectroscopy which detects ZEKE ions provides vibrational information of ions. In the MATI experiment, the second UV laser serves as an excitation source to excite the molecule in the first electronic excited state S1 to long-lived high-n Rydberg states.4,5 It follows that a pulsed electric field is applied to bring the Rydberg neutrals to the ionization limit. As a result, both prompt ions and ZEKE ions are simultaneously produced. This method rejects the non-energy-selected prompt ions and only detects ZEKE ions. Therefore, only parent ion signals appear in the mass spectrum. We have used this technique to study different molecular properties of molecular structural isomers.
2. Pulsed molecular beam two-color resonance-enhanced MATI spectrometer
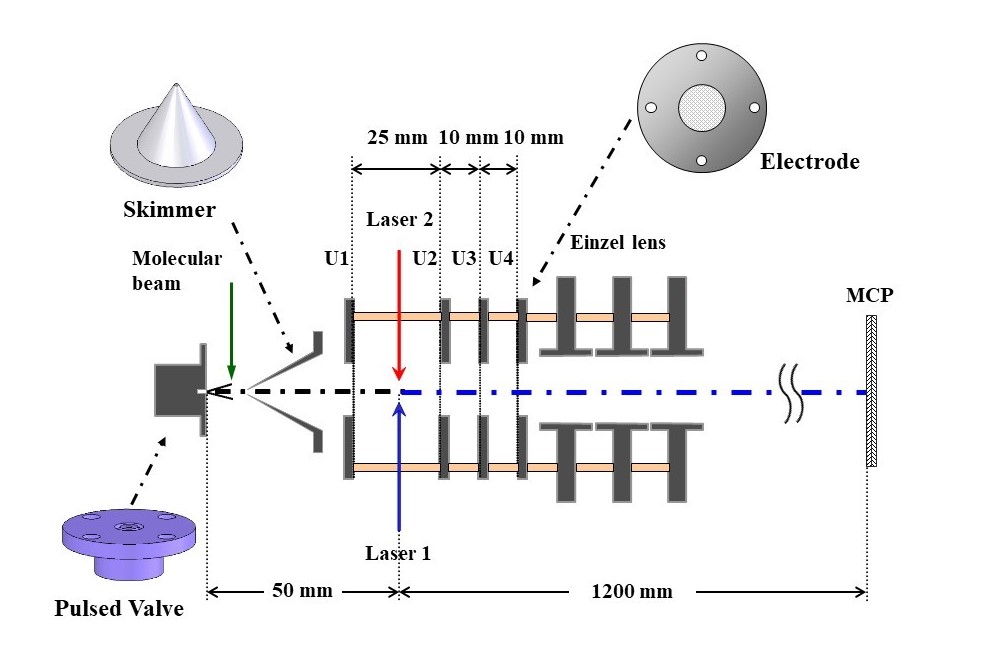
Our pulsed molecular beam two-color resonance-enhanced multiphoton MATI spectrometer consists of (1) a pulsed molecular beam, (2) a linear-type time-of-flight (TOF) mass spectrometer (3) two wavelength-tunable UV lasers, (4) a time delayed electric pulse controlling unit, (5) an ion signal collection unit. The design of our mass spectrometer makes it relatively easy to manage the interaction between the two counter-prorogating laser beams and the molecular beam, as seen in Figure 2. A molecular beam17,18 has the following characteristics: (1) The density of gas molecules is high, (2) All molecules move in the same direction with nearly the same speed, (3) There is no collision among molecules. Therefore, the technology of molecular beams can be used to prepare molecules at very low temperature (e.g., translational energy < 0.01 K, vibrational energy 150 K, rotational energy < 1 K). In other words, molecules are prepared in a ground state, where they hardly move, but still rotate and slightly vibrate. A laser has the following characteristics: (1) The density of photons is high, (2) All photons move in the same direction in the same phase, (3) There is no collision among photons.
The molecular beam and the UV lasers are pulsed. The pulse width of the molecular beam is about 100 ms, monitored with a vibration sensor. The pulse width of the UV laser is about 4-6 ns, measured with a fast photodiode. In the TOF spectrometer, the time zero is set when molecules are ionized. The triggering and synchronization of these pulses are controlled by a delay/pulse generator. Because this sophisticated scientific apparatus is complex and costly, we gradually designed and constructed the instrument. We briefly describe these projects as follows.
|
|
|
Figure 2. Schematic diagram of the pulsed molecular beam two-color resonance-enhanced multiphoton mass-analyzed threshold ionization spectrometer |
2.1 Pulsed molecular beam MPI-TOF spectrometer
The internal components of the pulsed molecular beam multiphoton ionization (MPI) TOF spectrometer we built are all installed in a high-vacuum system, which mainly includes four parts: (1) pulsed molecular beam source gas chamber, (2) molecular beam-laser intersection region, (3) ion flight tube, (4) ion detection region. The main component of the molecular beam source is a pulsed gas valve with operating frequency of 10 Hz. The gas stagnation pressure P0 in the pulsed valve is about 2000 Torr. When it is closed, the high pressure inside the valve is isolated from the vacuum chamber outside the valve. When the valve is opened, the gas is sprayed into the vacuum chamber from the high-pressure chamber through a nozzle with a diameter of 0.15 mm. The background pressure of the vacuum chamber is about 5 x 10⁻⁸ Torr. This condition causes adiabatic expansion or supersonic expansion. A conical skimmer (20 mm high, 1 mm top opening diameter, and 20 mm bottom diameter) is installed about 10.5 mm in front of the nozzle. Therefore, only the middle portion of the supersonic molecular beam enters the molecular beam-laser interaction region through this skimmer.
The second region of our mass spectrometer is the molecular beam-laser intersection region, where molecules are excited and then ionized by the laser. The background pressure of this region is usually maintained below 5 x 10⁻⁹ Torr, and it was raised to about 5 x 10⁻⁸ Torr in the experiment. This vacuum chamber contains a TOF electronic and ion focusing lens groups. The left and right ends of this chamber have windows with UV light specification. The UV laser beam enters the vacuum chamber through a window, interact with the molecular beam in the middle of the two electrode plates U1 and U2 and exits through another window. The distance from the nozzle orifice of the molecular beam pulse valve to the intersection center of the molecular beam and the laser is 50 mm. The width of the molecular distribution is about 5 mm, and the molecular density is estimated to be 1013 molecules per cubic centimeter.
As shown in Figure 2, the electrode plates of the TOF electronic lens group from near to far of the conical skimmer are U1, U2, and U3 respectively. Before 1998, the distance between each of the three electrode plates was 1 cm, and the central aperture was 13 mm. The voltages of U1 and U2 are provided by two high-voltage power supplies. Usually, the voltage of U1 is higher than U2. Plates U3 and U4 are grounded at zero potential. Between U1 and U2, when molecules are ionized by the laser light to generate ions with a so-called birth potential. In a typical MPI experiment, the voltages at 2200 V and 2000 V. It follows that a newly generated ion at the molecular beam-laser interaction will have a birth potential of 2100 eV. This ion will then be accelerated in the first electrical field of 200 V/cm between U1 and U2 and the second electrical field of 2000 V/cm between U2 and U3. Therefore, this arrangement of the TOF electronic lens groups are called two-stage TOF electronic lens assembly, introduced by Wiley and McLaren19 for improving the resolution of a TOF spectrometer. The electrode plates U5, U6, and U7 can be called a three-in-one electronic lens set (einzel lens), which is used to focus ions. U5 and U7 are usually grounded, and U6 is supplied with a high voltage, which can be positive or negative. In a typical experiment, U6 is set at 300 V. The connection and support of the TOF electronic lens group and the einzel lens group are connected to ceramic rods, and the entire lens group is directly locked on a stainless-steel cylinder.
There is no electric field effect in the flight tube area. The purpose of this area is to allow metastable ions to undergo structural rearrangement to achieve the most stable structure. The flight duct is a stainless-steel cylinder whose background pressure was maintained below 5 x 10⁻⁹ Torr, rising slightly to about 1 x 10⁻⁸ Torr during the experiment. A stacked microchannel plate (MCP) is placed in the ion detection region. Each channel acts as an electron multiplier. When the ion enters the channel and hits the stacked MCP, a large number of electrons (electric current) is generated. The current is sent to a signal collection instrument to generate ion signals on the mass spectrometer. Usually, the pressure in the ion detection region is maintained at about 2 x 10⁻⁹ Torr. The MPI experiment involves the detection of weak ion signals. Therefore, the technique of ion counting and accumulation must be applied. Here, we use a multichannel scaler (MCS) to collect ion signals. At the same time, we use a digital oscilloscope to measure the intensity of the laser for spectral calibration. So that the spectrum we record is minimally disturbed by the instantaneous instability of the laser intensity.
We used the pulsed molecular beam MPI-TOF spectrometer to measure the laser beam waist in the molecular beam-laser interaction center.20 In a typical experiment, the laser is controlled to have a beam waist of about 600 mm. We use this pulsed molecular beam MPI-TOF mass spectrometer to investigate stable structures and dissociation processes of mixed ammonia-benzene cluster ions.21 We also studied the intra-cluster reactions of methylamine, dimethylamine and trimethylamine molecular clusters.22 At the same time, we learn how to use the Gaussian program to calculate the binding energy of cluster ions for predicting the stabilities of cluster ions. The calculated results reasonably supported the experimental findings.
2.2
Pulsed molecular
beam REMPI-TOF spectrometer
We further improved
the instrument to perform
resonance-enhanced multiphoton ionization (REMPI) experiment for recording the
vibronic spectrum of
benzene derivatives.
It is done
mainly by adding a dye laser pumped by the existing single frequency UV laser.
This wavelength-adjustable UV laser is used as the photoionization source for
our TOF mass spectrometer. We use this pulsed molecular beam REMPI-TOF mass
spectrometer to record the vibronic spectrum of phenylacetylene.23 In
1994, Orlandi et al.24 performed the configuration interaction
singles (CIS) calculations to predict molecular geometry and vibrational
frequency of benzene in the in the S1 state. Therefore, we use the
Gaussian program to perform the CIS calculations to calculate the vibrational
frequencies of the 30 fundamental vibrations of phenylacetylene in the S1
state. In addition, we develop a procedure to plot the motion for each normal
vibration. These ab initio calculations and plot procedures help us successfully
assign the obtained vibronic spectrum.23 We also use this instrument
to find out that styrene (mass 104 amu) impurities exist in three commercial phenylacetylene
(mass 102 amu) chemical samples.25
To demonstrate the advantages of mass resolution combined with REMPI spectroscopy, we conducted experiments to record vibronic spectra of various isotopomers of aniline simultaneously. The samples were prepared as follows: (1) adding heavy water (D2O) to aniline C6H5NH2, (2) adding water (H2O) to deuterated aniline (C6D5ND2). Because these isotopic species differ in mass, by using mass-gating technique, we successfully recorded the unique vibronic spectrum for each of C6H5NH2, C6H5NDH, C6H5ND2, C6D5NH2, C6D5NDH, and C6D5ND2.26 Our experimental data show that the difference in the electronic excitation energy of these isotopomers is only a few, a few tens, to a few hundred wavenumbers (cm-1). These data also prove that the H/D exchange only occurs at the amino group.
2.3 Pulsed molecular beam two-color resonance-enhanced multiphoton MATI spectrometer
In mid-April 1998, Professor K. Müller-Dethlefs, one of the inventors of ZEKE photoelectron spectroscopy, was invited to visit our research institute. After visiting the laboratory, he enthusiastically and patiently explained to me the principle of ZEKE photoelectron spectroscopy. He emphasized that this technology can record high-resolution ion spectra for studying molecular properties. After reading many relevant papers, I decided to modify our existing instrument to perform the MATI experiments to study molecular ion properties.
The modification of the existing pulsed molecular beam REMPI TOF spectrometer includes: (1) adding a second UV laser with tunable wavelength, (2) designing two low-interference pulsed high-voltage generators, (3) synchronizing the pulsed molecular beam and the two UV lasers, and (4) initializing time zero of the TOF mass spectrometer. After we completed the pulsed molecular beam two-color resonance multiphoton MATI spectrometer, we recorded the high-resolution vibrationally resolved ion spectra of 4-fluoroaniline through 6 different intermediate vibronic states.8 To make the instrument run more stably, we increased the distance between the electrode plates U1 and U2 of the TOF mass spectrometer from 1 cm to 2.5 cm (Figure 2), so that the prompt ions and Rydberg neutrals are more nicely separated.9
To investigate the characteristics of molecules in electronically excited and cationic states, we usually carried out (1) REMPI, (2) PIE, and (3) MATI experiments. If the first electronic excitation energy (E1) is greater than half of the IE of the molecule, a one-color REMPI experiment can be used to record the vibronic spectrum. Taking 2,4-difluoroanisole15 (IE = 67568 cm−1) as an example, the obtained vibronic spectrum provides information about the E1 (35556 ± 2 cm−1) and the active vibrations in the S1 state. If the E1 is smaller than half of the IE of the molecule, then a two-color REMPI experiment must be used to record the vibronic spectrum. For example, we fixed the ionization laser at 37368 cm−1 and scanned the frequency of the excitation laser for recording the vibronic spectrum of 4-cyanophenol.27 As a result, it showed that the E1 appeared at 35548 cm−1. In addition, many active vibrations of 4-cyanophenol in the S1 state were observed.
The first step to investigate the ionic property of a molecule is to measure the IE by carrying out a two-color REMPI experiment to record the PIE spectrum. Taking 2,4-difluoroanisole15 as an example, we fixed the excitation laser energy at 35556 cm−1 (E1) and scanned the frequency of the ionization laser. When the sum of the energy of two photons is less than the IE, there is no ion signal. When the energy sum of the two photons is greater than the IE, the ion signal suddenly becomes very strong. The sudden rise of the ion signal in the PIE curve marks the ionization limit. The IE of 2,4-difluoroanisole determined by this method is 67568 ± 10 cm−1.
To record high-resolution vibrationally resolved ion spectra by carrying out a two-color resonance multiphoton MATI experiment is somewhat challenging. Taking 2,4-difluoroanisole15 as an example, the experimental process is briefly described as follows. We first manage the molecular beam reaction with two counter-propagating UV lasers spatially and temporarily. The two counter-propagating UV laser beams were focused and intersected perpendicularly with the molecular beam at 50 mm downstream from the nozzle orifice.
The first UV laser was used to excite 2,4-difluoroanisole from the electronically ground S0 state to the S1 state (35556 cm−1). The second UV laser was then scanned to bring the electronically excited 2,4-difluoroanisole molecule to high n Rydberg states lying a few wavenumbers below the ionization limit. Under this condition, both prompt ions and Rydberg neutrals were formed simultaneously in the laser-molecular beam interaction zone. A pulsed electric field of −1 V/cm (duration = 10 μs) (−2.5 V at TOF plate U1; 0 V at plate P2; distance of plate U1 and U2 is 2.5 cm) was switched on about 18 ns after the laser pulses to guide the prompt ions towards the opposite direction of the MCP ion detector. Because the Rydberg neutrals were not affected by the electric field, they kept moving to enter the field ionization region. After a time delay of about 11.8 μs, a second pulsed electric field of +200 V/cm (+2250 V at TOF plate U2; +2050 V at plate U3; 0 V at plate U4; distance between any two of these three plates is 1 cm) was applied to field-ionize the Rydberg neutrals with n >100. The threshold ions were then accelerated and passed a 1.0 m field-free region before being detected by a dual-stack MCP ion detector. The ion signal from the detector was collected and analyzed by a multichannel scaler (MCS). The MCS and the transient digitizer were interfaced to a personal computer.
In contrast to the PIE method, in the MATI experiment, the threshold ions with zero kinetic energy were detected, and a sharp peak was obtained at the ionization threshold. The adiabatic IE of 2,4-difluoroanisole determined by the MATI technique is 67568 ± 10 cm−1. The major advantage of the MATI over the PIE method is that it can provide information on the internal motions of the cation. The active vibrations of the 2,4-difluoroanisole cation detected by our MATI experiments include (1) non-planar and planar ring-F bending, (2) planar ring-OCH3 bending, (3) planar ring deformation, (4) planar ring breathing, and (5) overtone and combination vibrations.
3. Identification of isomers of sandwich-type organometallic complexes
As mentioned previously, we have used our home-built pulsed molecular beam two-color resonance-enhanced multiphoton MATI spectrometer to record vibrationally resolved ion spectra for more than 130 multiply substituted benzene derivatives. These experimental data allow us to distinguish impurities, and can also be used to identify isomers of special compounds and explore their photophysical properties. We have also used this instrument to explore an interesting research subject. In the summer of August 2013, I participated in an international high-resolution molecular spectroscopy seminar in Hungary. During the conference, I met a scholar from the Institute of Organometallic Chemistry, Russian Academy of Sciences. Professor Sergey Yu. Ketkov told me that they could synthesize some sandwich-type organometallic compounds. Many of these compounds will react with oxygen in the air and must be synthesized in oxygen-free equipment. Therefore, the purification process is complex and difficult. From mass spectrometer analysis, they knew that the synthesized sandwich compounds often contain impurities. In addition, some sandwich compounds can be dissolved in organic solvents for spectral analysis. Because of the solvent effect, the absorption spectrum curve obtained with a commercial spectrometer is very broad. In 1992, they were lucky enough to obtain the UV absorption spectrum of gaseous (cyclopentadiene)(cycloheptatriene)chromium,28 and reported the IE of this sandwich compound for the first time. However, it is difficult to explain the photophysical and chemical characteristics. After listening to his description, I explained to him the peculiarities of our apparatus. We then discussed the possibility of solving the problem together. After I returned to Taiwan, I asked my research assistant to design a special sample vessel for pulsed molecular beams. After a preliminary experiment of a commercially available bis(benzene)chromium, I invited Professor Ketkov to bring his homemade sandwich compound samples to our laboratory in April 2014 to test the feasibility of the experiment. Fortunately, we successfully tested it and opened a series of collaborative research. Some results from our joint research have also been published in international scientific journals.29,30
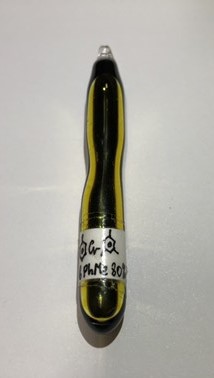
Like multiply substituted benzene derivatives, some sandwich compounds also have isomers. Here I briefly describe the process of our investigation of sandwich compounds as follows. The (mesitylene)(toluene)chromium sandwich compound sample is shown in Figure 3. Because this compound will react with oxygen in the air, we filled the compound into a sample dish in the glove box, then connected the sample dish to the sample container of the molecular beam. The ionization energy of most sandwich organometallic complexes is between 5 eV and 6 eV.1 So we can measure the IE by doing single-photon PIE spectroscopy experiments, and then conduct single-photon MATI experiments to obtain more accurate IE and ion vibration information. The experimental procedure is the same as that mentioned above. Because only one UV laser with an adjustable wavelength is needed, the MATI experiment is a little simpler. However, to handle the sandwich compounds in the pulsed molecular beam system is still quite tricky.
|
|
|
Figure 3, (mesitylene)(toluene)chromium sandwich compound sample |
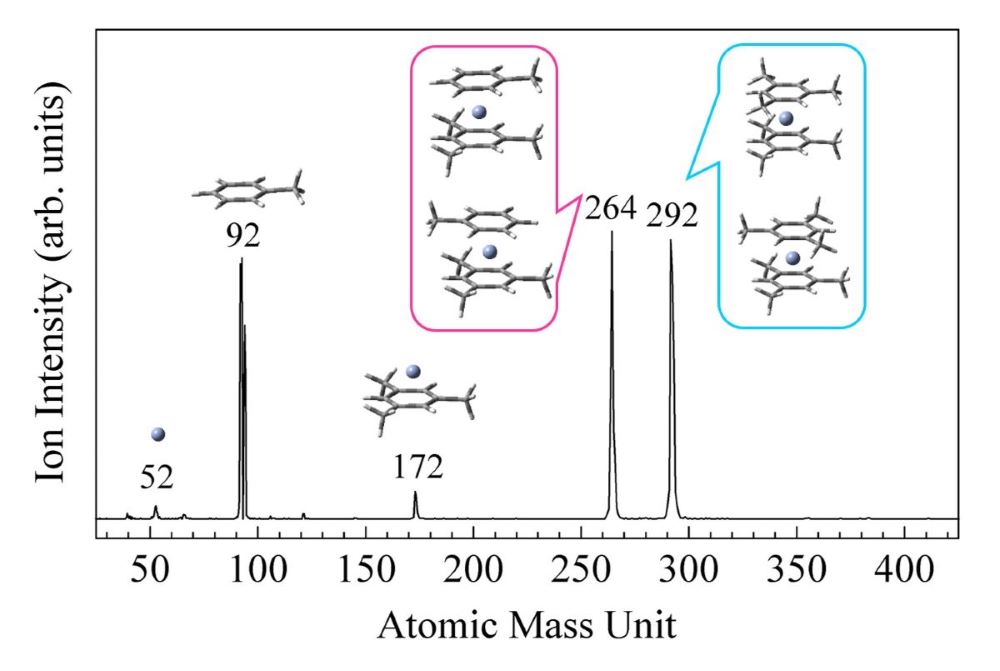
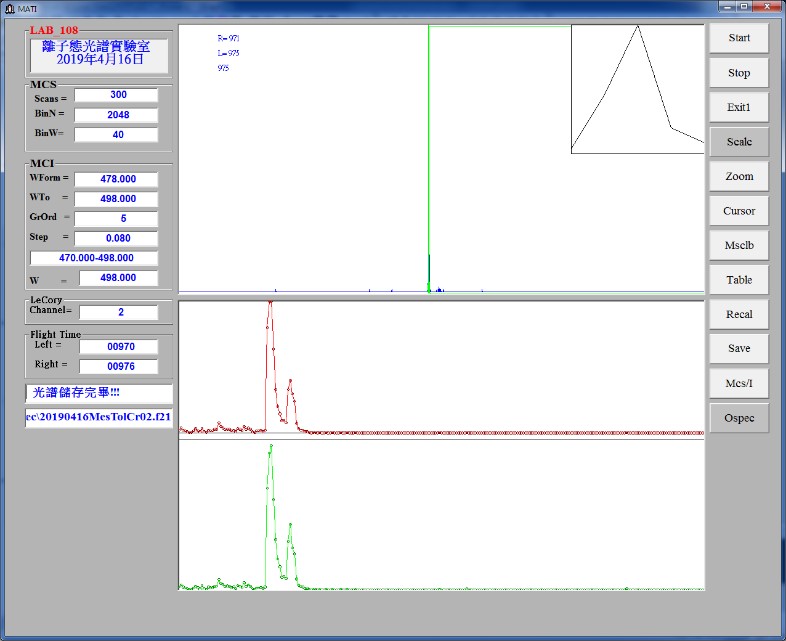
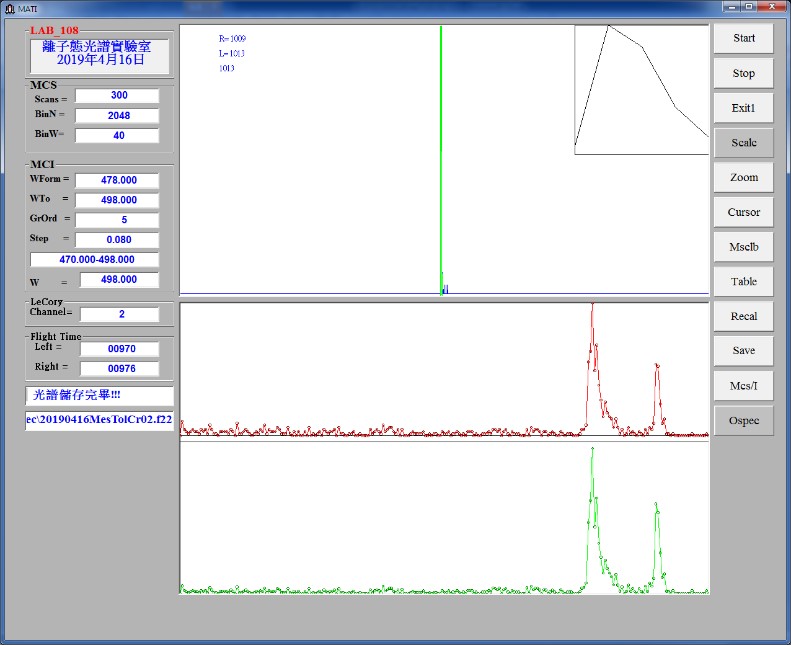
Figure 4 shows the mass spectrum of (mesitylene)(toluene)chromium sandwich compound sample at laser wavelength 240 nm). The peaks at 292, 264, 172, 92, and 52 amu result from the bis(mesitylene)chromium, (mesitylene)(toluene)chromium, mesitylene, toluene, and chromium ions. When we conduct the single-photon MATI experiment, we set the mass gate at 264 amu and scan the UV laser wavelength between 239 nm and 249 nm. The obtained MATI spectrum of (mesitylene)(toluene)chromium is shown in Figure 5, where the upper panel is the TOF mass spectrum, the green mark mass is set at 264 amu, the middle panel is the collected ions, and the X coordinate shows the scanning range from 239 nm (left) to 249 nm (right). The lower panel of Figure 5 is the collected ions after normalizing the laser intensity. When the spectra in the middle and lower panels are nearly the same, it means that the laser intensity is stable during the experiment. If there is a difference, it means that the laser is unstable. The laser must be checked before conducting the experiment. When we set the mass gate at 264 amu and scan the UV laser wavelength between 239 nm and 249 nm, the obtained MATI spectrum of bis(mesitylene)chromium is shown in Figure 6.
|
|
|
Figure 4, the mass spectrum of (mesitylene)(toluene)chromium sandwich compound sample |
|
|
|
Figure 5, (mesitylene)(toluene)chromium sample: (top) TOF mass spectrum, gated at 264 amu, (middle) MATI spectrum of (mesitylene)(toluene)chromium (bottom) MATI spectrum with laser intensity normalization |
|
|
|
Figure 6. (mesitylene)(toluene)chromium sample: (top) TOF mass spectrum, gated at 292 amu, (middle) MATI spectrum of bis(mesitylene)chromium, (bottom) MATI spectrum of bis(mesitylene)chromium with laser intensity normalization |
When reporting spectra in academic journals, the X coordinates are often displayed in energy units, so we converted the spectra in the lower part of Figure 5 and Figure 6 into spectra with X coordinates in energy units, as shown in Figure 7. Both (mesitylene)(toluene)chromium and bis(mesitylene)chromium are sandwich-type organometallic complexes. Each of them has two distinct features, as seen in Figures 5-7.
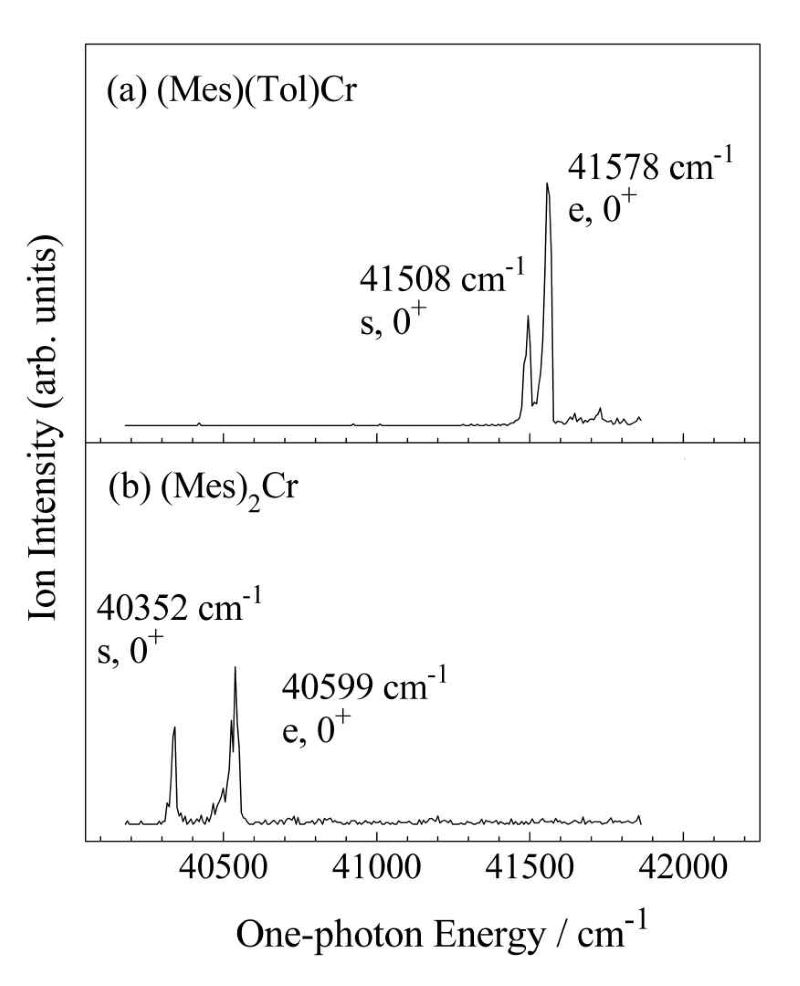 |
| Figure 7. MATI spectrum: (a) (mesitylene)(toluene)chromium, ie (Mes)(Tel)Cr (b) bis(mesitylene)chromium, ie (Mes)2Cr. |
We carry out the density intension theory (DFT) calculations at the B3LYP/6-311++(d,p) level to predict the stable structure of sandwich-type organometallic complexes. The calculated results show that both (mesitylene)(toluene) chromium and bis(mesitylene)chromium have two stable structures. The calculated results support our experimental findings.
References
[1] The NIST Chemistry Webbook. http://webbook.nist.gov/. The NIST Chemistry Webbook. http://webbook.nist.gov/.
[2] Müller-Dethlefs, K.; Sander, M.; Schlag, E. W.; Two-Colour Photoionization Resonance Spectroscopy of NO: Complete Separation of Rotational Levels of NO+ at the Ionization Threshold. Chem. Phys. Lett. 1984, 112, 291–294.
[3] Schlag, E. W. ZEKE Spectroscopy; University Press: Cambridge, UK, 1998.
[4] Merkt, F. Molecules in High Rydberg States. Annu. Rev. Phys. Chem. 1997, 48, 675-709.
[5] Chupka, W. A. Lifetimes of Very High Rydberg States of Aromatic Molecules. Chem. Phys. 1993, 99, 5800-5806.
[6] Zhu, L.; Johnson, P. Mass Analyzed Threshold Ionization Spectroscopy. J. Chem. Phys. 1994, 94, 5769–5771.
[7] Telle, H. H.; Urena, A. G.; Donavan, R. J. Laser Chemistry: Spectroscopy, Danamica, and Applications; John Wiley & Sons, Ltd.: West Sussex, England, 2007.
[8] Tzeng, W. B.; Lin, J. L. Ionization Energy of p-Fluoroaniline and Vibrational Levels of p-Fluoroaniline Cation Determined by Mass-Analyzed Threshold Ionization Spectroscopy. J. Phys. Chem. A 1999, 103, 8612–8619.
[9] Xu, Y.; Tzeng, S. Y.; Shivatare, V.; Takahashi, K.; Zhang, B.; Tzeng, W. B. Identification of Four Rotamers of m-Methoxystyrene by Resonant Two-Photon Ionization and Mass-Analyzed Threshold Ionization Spectroscopy. J. Chem. Phys. 2015, 142, 124314.
[10] Lin, J. L.; Yang, S. C.; Yu, Y. C.; Tzeng, W. B. Mass Analyzed Threshold Ionization of p-Bromoaniline: Heavy Atom Effects on Electronic Transition, Ionization, and Molecular Vibration. Chem. Phys. Lett. 2002, 356, 267-276.
[11] Yang, S. C.; Lin, J. L.; Tzeng, W. B. Mass Analyzed Threshold Ionization Spectroscopy of p-Ethylaniline Cation: Alkyl Chain Effects on Ionization and Molecular Vibration. Chem. Phys. Lett. 2002, 362, 19-25.
[12] Lin, J. L.; Lin, K. C.; Tzeng, W. B. Mass Analyzed Threshold Ionization Spectroscopy of o-, m-, p-Methylaniline Cations: Vicinal Substitution Effects on Electronic Transition, Ionization, and Molecular Vibration. J. Phys. Chem. A 2002, 106, 6462-6468.
[13] Lin, J. L.; Tzeng, W. B. Mass Analyzed Threshold Ionization of Deuterium Substituted Isotopomers of Aniline and p-Fluoroaniline: Isotope Effect and Site-Specific Electronic Transition. J. Chem. Phys. 2001, 115, 743-751.
[14] Li, C.; Lin, J. L.; Tzeng, W. B. Mass Analyzed Threshold Ionization Spectroscopy of the Rotamers of p-n-Propylphenol Cation and Configuration Effect. J. Chem. Phys. 2005, 122, 044311.
[15] Tzeng, S. Y.; Takahashi, K.; Tzeng, W. B. Two-Color Resonant Two-Photon Mass-Analyzed Threshold Ionization of 2,4-Difluoroanisole and the Additivity Relation of Ionization Energy. J. Phys. Chem. A 2020, 124, 10517-10526.
[16] Tzeng, S. Y.; Shivatare, V. S.; Tzeng, W. B. Cation Vibrations of 1-Methylnaphthalene and 2-Methylnaphthalene through Mass-Analyzed Threshold Ionization Spectroscopy. J. Phys. Chem. A 2019, 123, 5969-5979.
[17] Ramsey, N. F. Molecular Beams; Oxford University Press: New York, U.S.A., 1956.
[18] Scoles, G. Atomic and Molecular Beam Methods; Oxford University Press, Inc.: New York, U.S.A., 1998.
[19] Wiley, W. C.; McLaren, I. H. Rev. Sci. Instrum. 1955, 26, 1150-1157.
[20] Wang, C. R. C.; Hsu, C. C.; Liu, W. Y. Tsai, W. C.; Tzeng, W. B. Determination of Laser Beam Waist Using Photoionization Time-of-Flight Mass Spectrometer, Rev. Sci. Instrum. 1994, 65, 2776-2780.
[21] Tsai, W. C.; Yeh, W. H.; Tzeng, W. B. Multiphoton Ionization of Benzene-Ammonia Clusters: Intracluster Reaction and Cluster Ion Stability. J. Chin. Chem. Soc. 1994, 41, 505-509.
[22] Tzeng, W. B.; Narayanan, K.; Chang, G. C.; Tsai, W. C.; Ho, J. J. Intracluster Reaction, Fragmentation and Structure of Monomethylamine, Dimethylamine and Trimethylamine Clusters Ions. J. Phys. Chem. 1996, 100, 15340-15345.
[23] Narayanan, K.; Chang, G. C.; Shieh, K. C.; Tung, C. C.; Tzeng, W. B. S1 ← S0 Transition of Phenylacetylene: Ab Initio and Resonant Two-Photon Ionization Studies. Spectrochim. Acta A 1996, 52, 1703-1716.
[24] Orlandi, G.; Palmieri, P.; Torroni, V.; Takahashi, R.; Zerbetto, F,; Zgierski, M. Z. J. Chem. Phys. 1994, 100, 2458-2464.
[25] Tzeng, W. B.; Narayanan, K.; Chang, G. C. Detection of Styrene Impurities in Phenylacetylene by Resonant Two-Photon Ionization Mass Spectrometry. Appl. Spectrosc. 1999, 53, 731-893.
[26] Tzeng, W. B.; Narayanan, K.; Chang, G. C. Simultaneous Detection of C6H5NHD, C6H5ND2, C6D5NH2, C6D5NHD, and C6D5ND2”, by Resonant Two-Photon Ionization Mass Spectrometry. Appl. Spectrosc. 1998, 52, 890-734.
[27] Li, C.; Pradhan, M.; Tzeng, W. B. Mass Analyzed Threshold Ionization Spectroscopy of p-Cyanophenol Cation and the CN Substitution Effect. Chem. Phys. Lett. 2005, 411, 506-510.
[28] Ketkov, S. Y. Vapor-Phase Electronic Absorption Spectrum of (h5-Cyclopentadienyl)(h5-Cycloheptatrienyl)Chromium. J. Organomet. Chem. 1992, 429, C38-C40.
[29] Ketkov, S. Y.; Markin, G. V.; Tzeng, S. Y.; Tzeng, W. B. Fine Substituent Effects in Sandwich Complexes: First Threshold Ionization Study of Monosubstituted Chromium Bisarene Compounds. Chem. Eur. J. 2016, 22, 4690-4694.
[30] Ketkov, S. Y.; Rychagova, E. A.; Kalakutskaya, L. V.; Fuss, M.; Braunschweig, H.; Tzeng, W. B. Rydberg State Mediated Multiphoton Ionization of (h7-C7H7)(h5-C5H5)Cr: DFT-Supported Experimental Insights into Molecular and Electronic Structures of Excited Sandwich Complexes. Phys. Chem. Chem. Phys. 2019, 21, 9665-9671.